01
Test requirement definition
Define the test article, target endpoints and dose range.
Turning "visible vascular change" into "quantifiable, comparable, deliverable toxicology evidence" — that is the whole of what VasoPT does.
From test requirement to risk report, every step has defined inputs and deliverables, keeping results comparable across batches and projects.
Define the test article, target endpoints and dose range.
Set the exposure regimen, controls and replicates.
Acquire zebrafish cardiovascular and vascular network images.
Unified positioning and selection of high-quality images.
Automatically identify vessel regions and key structural boundaries.
Extract area, branching, density and morphology metrics.
Produce a toxicity score and resolve dose-related change.
Deliver the risk grade, conclusions and a visual report.
Standardized storage and structured management build a high-quality vascular toxicity database.
Continuous training and optimization improve accuracy and generalization.
Extend scenarios and test articles, supporting multi-endpoint and multi-scale assessment.
Converting complex vascular images into numerical results: five steps that turn looking into reading.
Automatically locate vessel structures, region boundaries and the main vascular network.
Convert complex images into computable regions, lines and network objects.
Extract morphology, branching, density, length, diameter and regional injury parameters.
Combine multi-dimensional change into a toxicity score, risk grade and priority order.
Retain image data, phenotype parameters, dose relationships and risk scores.
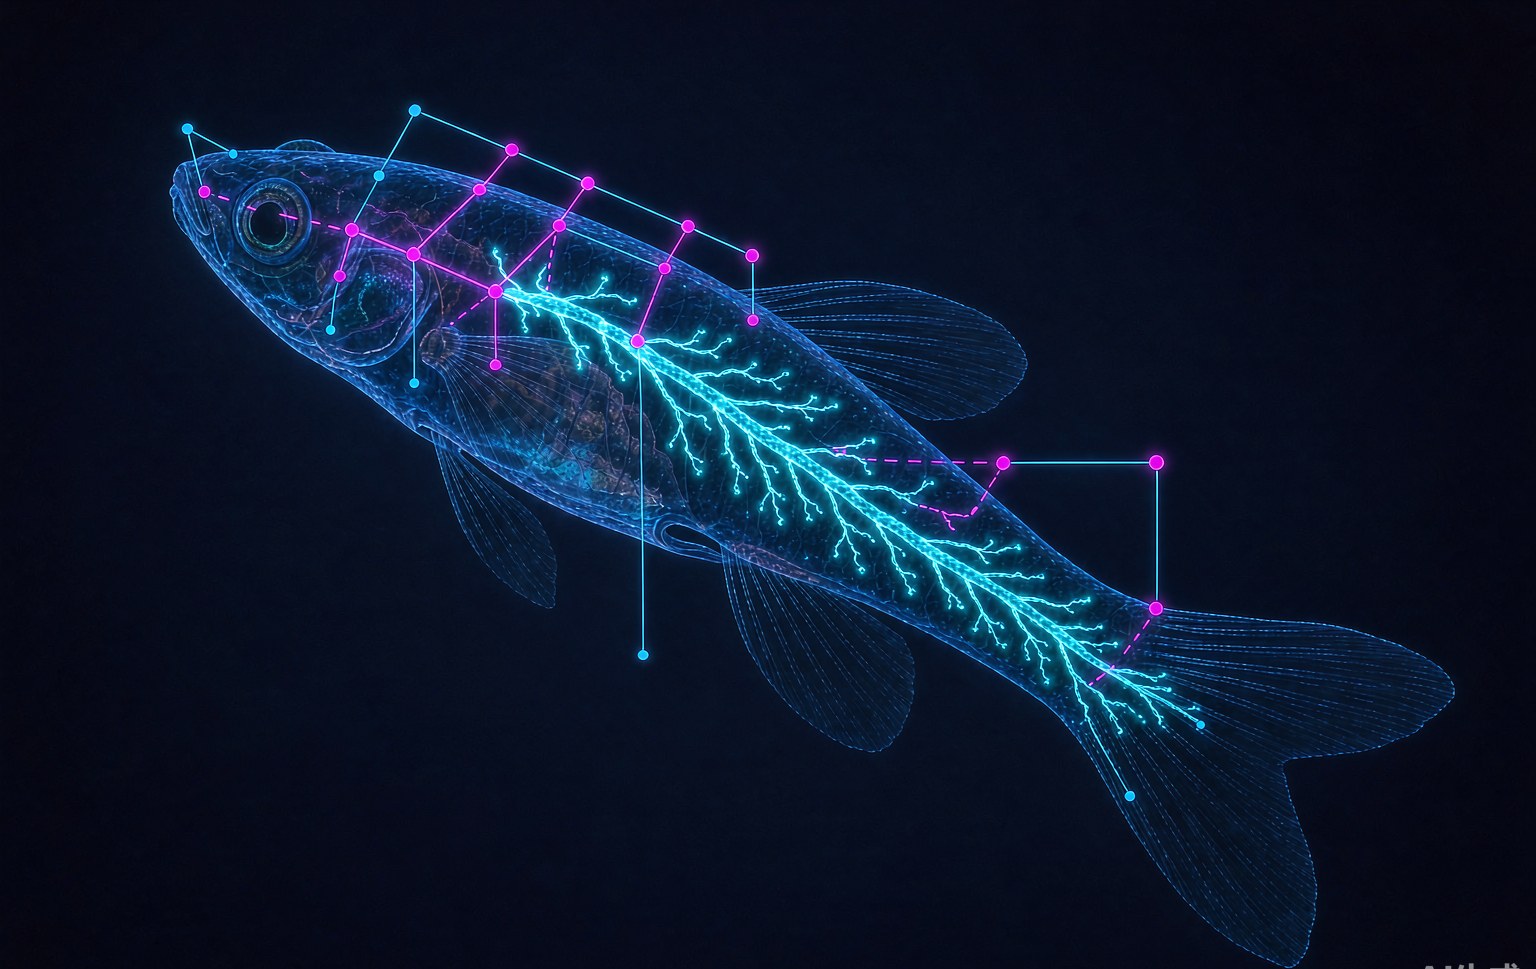 Vessel skeleton · nodes · branch measurement
A single metric is easily misled by noise; only a multi-dimensional matrix reflects the true state of the vascular network. All metrics are extracted under one standard, enabling comparison across samples and batches.
Phenomics is the sum of traits expressed by individuals of a given genotype under defined environmental conditions. Applied to vessels, it means looking at the whole network, not a single point.
A vascular network carries branching, density, diameter, orientation and regional variation — a quantifiable phenotype space.
Quantifying vascular morphology is difficult, and many phenomic metrics resist high-throughput capture — precisely what AI and high-content imaging address.
Intuitive, efficient, accurate and effective — well suited to large-scale screening and ranking at an early stage.
Scope of application VasoPT is positioned as an early screening and prioritization tool that rapidly identifies vascular toxicity signals among candidates; it does not replace formal regulatory nonclinical safety assessment. Endpoints, dose design and report use are as agreed before project start.
Share your sample type and assessment goal, and we will propose a complete path from imaging to report.